

The catalogue release paper gives details on the data selection, the data processing, and the catalogue construction. Here an executive summary is given.

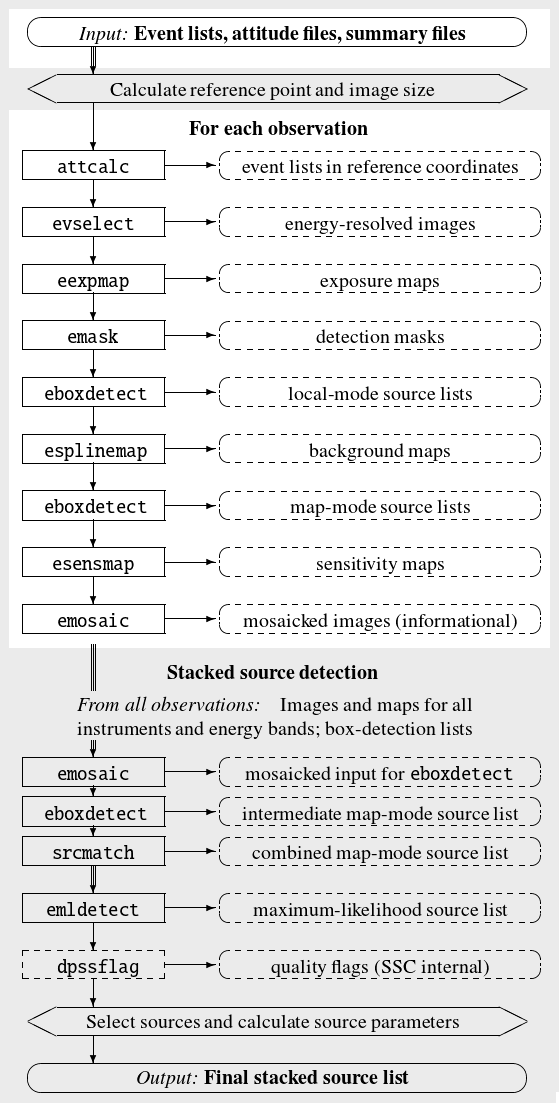
The new catalogue is based on archival XMM-Newton attitude files, and event lists which were processed with the XMM-Newton Science Analysis Software. The 2XMM User Guide describes the catalogue pipeline in details, the User Guides to 3XMM-DR4 and 3XMM-DR7 list the updates for the 3XMM catalogue series. For the stacked catalogue, the 3XMM data handling has been adjusted to the needs of source detection on multiple observations, using the same parameters as in the 3XMM pipeline wherever applicable. The new standardised approach to perform stacked source detection on multiple observations is available as SAS tasks edetect_stack. Input data to source detection are prepared for each observation individually, and source detection is run on all input data in parallel, namely: images, exposure maps, and background maps for each observation, instrument, and energy band, and detection masks for each observation and instrument. The final source parameters are calculated by edetect_stack.
The EPIC background includes an internal instrumental background and external components such as the cosmic X-ray background together with a time-variable local particle background linked to the complex interaction of solar activity with the Earth's magnetosphere. For source detection, time intervals dominated by variable background dominates are filtered from the event lists. The remaining background is modelled based on source-free ("cheesed") images by the task esplinemap and subtracted from the original images within the source-detection tasks. To construct the cheesed image, circular regions are excluded at the position of each tentative source, based on a brightness cut at 5×10⁻⁴ cts arcsec–2 s. For the stacked catalogue, an adaptive smoothing method has been employed to model the background emission. The cheesed images and corresponding masks are smoothed by convolving them with a Gaussian kernel with an initial smoothing radius of 10 pixels, and the signal-to-noise ratio of the smoothed image is calculated at each pixel. In eight steps, the radius of the Gaussian kernel is increased by a factor of square root of two. For each image pixel, the two smoothed images with the signal-to-noise ratios closest to a pre-defined threshold of 30 are selected, opting for a uniform signal-to-noise ratio over the whole image, which limits the allowed noise fluctuations. The background value of the pixel is linearly interpolated between them. Small-scale structures are thus covered by the images with the narrowest smoothing radii, while the cut-out regions around the sources are filled by values from the images smoothed with a broad Gaussian kernel.
All data products are used in parallel by the source-detection tasks, coupling images, exposure maps, and background maps for each observation, instrument, and energy band, and detection masks for each observation and instrument. Simultaneous source detection is performed by means of the usual two-step process used for XMM-Newton data: sliding-box source detection followed by maximum-likelihood fitting, described in the 2XMM User Guide. Deviating from standard source detection
A separate module of the task edetect_stack is dedicated to the calculation of the final source parameters, the quality assessment, and source filtering. In particular, the total equivalent likelihood over all observations and the likelihood for each individual observation are calculated for each detection and used for source selection. Sources are included in the final source list, if at least one of these equivalent likelihoods exceeds a user-defined minimum detection likelihood. As for the 3XMM catalogues, a minimum likelihood of six is required.
Observations with high particle-induced background need to be identified before performing source detection for the stacked catalogue since their low signal-to-noise typically lowers the overall detection likelihoods of sources in the field and causes loss of sources. The optimised flare filtering of the 3XMM catalogues efficiently excludes intervals of high flaring background which are shorter than the total exposure time, but performs less well if it comes to images with high background throughout the observation time. In the 3XMM catalogues, these observations and the detections taken from them have been marked by a HIGH_BACKGROUND flag after source detection. From the stacked catalogue, they were excluded beforehand, in order not to contaminate good observations.
They were identified via a new standardised approach based on mean background count rates per unit area in the broad 0.2–12.0 band. From the bulk of 3XMM-DR7 observations in full-frame and large-window mode, a distribution of background rates is derived for each instrument and used to define rate cuts. Details on the method can be found in the catalogue paper. Observations with background rates above the limit were not used for the stacked catalogue (see next Section).
The catalogue of sources in overlapping observations is based on data used to compile the 3XMM catalogues from individual observations and their selection criteria: Observations enter the 3XMM catalogues, if they have a minimum net exposure time of 1 ks, which is the sum of good-time intervals after filtering the event lists, and non-empty images in all five energy bands. This first release of a stacked catalogue comprises good-quality observations which are selected if they fulfil the following five selection criteria (numbers in parentheses give the number of 3XMM-DR7 observations remaining after each filtering step).
The final 3XMM-DR7s sample includes 1 789 observations in 434 groups, the majority of them having two or three members.
For each of the groups of observations, stacked source detection is run using the new task edetect_stack. The stacked catalogue is constructed from the resulting unique source lists and comprises 71 951 sources. It lists the parameters from the combined fit for each source and, in addition, one line for each observation that was involved in this fit. All source parameters are directly derived from the results of the simultaneous fit to all observations in a stack. Values per observation refer to the subset of images taken during this observation. The catalogue can be reduced to the one-source-one-row layout of the 3XMM source catalogues using a selection expression on the identifier columns described below such as N_CONTRIB. Its columns are mostly organised in the style of the 3XMM catalogues with the same definitions of their values wherever applicable and fully listed here. This section describes the most relevant parameters, modifications to the 3XMM column definitions, and newly introduced columns.
Source identifier. The unique source identifier in the stacked
catalogue is a 16-digit number, composed by (i) a preceding 3,
continuing the 3XMM convention that the detection identifier of individual
detections starts with a "1" and the source identifier of unique
matches between them starts with a "2", followed by (ii)
the lowest OBS_ID of the contributing observations (10 digits), and
(iii) the identifier within
the emldetect
source list (5 digits), for example 3020624020100030 for the thirtieth
detection in a stack with 0206240201 being the lowest identifier of all the
observations during which the detection was in the field of view. The
five-digits identifiers are not continuous, because the temporary
emldetect
source list comprises all input detections, true or spurious, and only the
significant ones among them are transferred to the final source list.
Each source is attributed a unique IAUNAME of the form
"3XMMs hhmmss.s+-ddmmss", composed of the identifier
"3XMMs" and the truncated sexagesimal right ascension and declination of the
source. "s" stands for its origin in the stacked catalogue.
Observations included. Column N_OBS gives the total number of observations per stack, column N_CONTRIB the number of contributing observations for which the source position is inside the field of view. Both column values are set to null in the observation-specific rows and can thus be used easily to select the summary rows per source, for example by the expression "N_CONTRIB gt 0".
Source coordinates. The position of the source is the result of the simultaneous fit and considered to be the same in all contributing observations and images, while the number of source counts are determined separately per image, They are given in equatorial, galactic and image coordinate systems in the RA, DEC, LII, BII, and X_IMA, Y_IMA columns, respectively. Image coordinates refer to the images of the combined observations of a stack in their common coordinate system and are listed together with their 1σ errors. The combined position error RADEC_ERR is the square root of the sum of the squared 1σ errors on the image coordinates. For symmetric errors in both dimensions, RADEC_ERR divided the square root of two is the one-dimensional 1σ position error, giving the coordinate interval that includes 68% of normally distributed data points. RADEC_ERR times the square root of 2.3/2 is the two-dimensional error, giving the radius of a circularised ellipse that includes 68% of normally distributed data points.
Equivalent likelihoods. Maximum detection likelihoods are determined per input image, summed, and converted from the total number of degrees of freedom to the equivalent of a two-parameter fit. For the stacked catalogue, sources with an equivalent likelihood of at least six over the whole stack or for at least one contributing observation are selected.
Source flux. The fitted count rate per image is converted into flux using the energy conversion factors of the 3XMM catalogues. All-EPIC source fluxes are error-weighted means of the fluxes per instrument and observation. They are null with undefined flux errors, but non-zero count errors for an observation if no counts are found within the PSF area of a source. The ECFs depend on the instrument, the observing mode, and the filter used, on the off-axis position of the source, and on its spectral shape. Therefore, the combined fluxes merging different instruments and merging different instrumental setups across the observations are affected by cross-calibration uncertainties. The underlying spectral model of the 3XMM ECFs is an absorbed power law with a column density of 3×1020 cm–2 and a photon index of 1.7.
Source extent. The radial extent of a source is parameterised via a beta model and fit simultaneously in all observations. Sources with an extent below 6″ or an extent likelihood below 4 cannot be resolved and are considered point-like. Their source extent is set to zero and their extent likelihood to null.
Mask fraction. The PSF-weighted detector coverage of a source is given for each instrument separately. During an observation, it is conservatively defined like in the other 3XMM catalogues as the minimum mask fraction of the five energy bands, indicating the most restrictive mask. The stacked mask fraction is the largest mask fraction of the contributing observations, indicating the best observation.
Source flags. A modified version of the SSC internal task dpssflag, the task also in use for the 3XMM catalogues, is employed for an automated quality flagging to warn the user about complexities in the environment of the source that might affect the significance of the detection or the source parameters and their accuracy. Strings of nine booleans per instrument indicate different potential issues of a detection, described in detail in the 2XMM User Guide. The nine booleans are converted to a single integer summary flag STACK_FLAG. Sources with a flag value of "0" come without any warning. Flag "1" indicates reduced detection quality: low detector coverage or a source position close to another source or to bad detector pixels. The list of known bad pixels is hard-coded within the task dpssflag. "2" is attributed to potentially spurious sources, for example those found within the PSF radius of another source. A flag value of "3" in the summary row indicates that the source has received flag 2 in several contributing observations. The integer flags are not directly comparable with the integer SUM_FLAG in the other 3XMM catalogues, which have been set for individual observations and include additional information from visual screening of the detections.
Long-term variability between observations. Five new sets of source
parameters provide information on the inter-observation variability of a
source directly from the source fluxes and their errors. Each of them is
determined from the all-EPIC fluxes in all contributing observations and
from the fluxes in each of the five standard energy bands separately,
i.e. has got six columns in total.
VAR_CHI2 is a reduced chi square of flux variability between the all-EPIC
flux over all observations and the individual fluxes per observation. The
associated VAR_PROB describes the probability that the observed flux values
are consistent with constant source flux over all observations. It is the
cumulative chi-square probability to reach at least VAR_CHI2 in the given
number of input images. A low value of VAR_PROB thus indicates a high chance
that the source shows inter-observation flux variability.
FRATIO gives the ratio between the highest and lowest value of the fluxes
per observation, and FRATIO_ERR its 1σ error.
FLUXVAR is the largest difference between pairs of fluxes per observation in
terms of sigma.
Observation characteristics. Each row per observation includes the modified Julian dates of its start and end time. In the summary row per source, the MJDs of the beginning of the first and the end of the last contributing observation are given. Filter, instrument submode, and mean position angle of the spacecraft are listed per observation.
Columns copied from 3XMM-DR7. Since the stacked catalogue is based on a subset of 3XMM-DR7 observations, its sources have been positionally cross-matched with the 3XMM-DR7 catalogue of unique sources. Two sources are associated if their separation is no larger than the sum of three times the positional uncertainty of each source. For the sources in the stacked catalogue, the pure statistical position error RADEC_ERR is used, and for the unique 3XMM-DR7 sources their combined SC_POSERR. The error sum is assumed to be at least one arcsecond to account for systematic errors. For each associated 3XMM-DR7 source, information on position, quality flag, and intra-observation variability are copied to the summary rows of the stacked catalogue. The observation-specific rows list the parameters of the 3XMM-DR7 detection that contributes to the unique source, if one is found. Column DIST_3XMMDR7 gives the distance between the stacked detection and the 3XMM-DR7 counterpart.
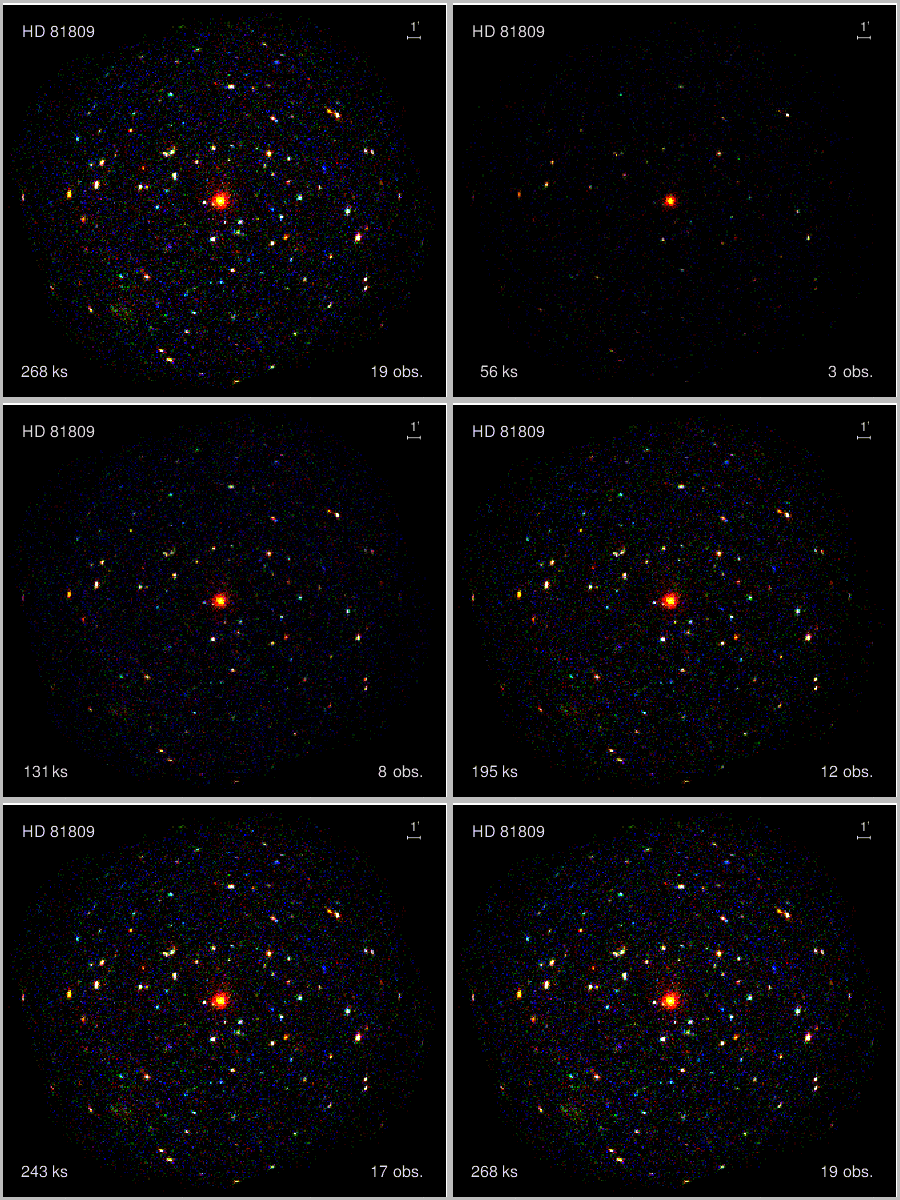
Four types of auxiliary images are produced for the stacked catalogue and provided in the XSA interface:
The catalogue is based on a selection of good-quality observations. In particular, repeated observations of a field have not entered the stacked catalogue if they have been attributed a 3XMM-DR7 OBS_CLASS above 2.
The detection likelihoods, calculated as the mathematical equivalent of a two-parameter fit, can be low if very few source counts are distributed across many images, and faint sources may be lost due to purely statistical reasons. The effect is largely compensated by the refined box-detection strategy and source-selection criteria used to construct the stacked catalogue.
Although the number of spurious detections is likely reduced by stacked source detection with respect to the individual observations, spurious detections for example along instrumental features, stray light, or residuals in the PSF fit to bright sources have entered the catalogue. They are partly owed to the more flexible criterion of a sufficiently high detection likelihood during at least one contributing observation to transfer a detection to the catalogue. Many of them can be identified by visual inspection of the images. A filtering expression on a total detection likelihood above six helps to further decrease the amount of potentially spurious detections at the expense of losing transient sources.
The source quality flags are purely derived by the automated quality assessment of a modified version of the task dpssflag without visual screening. They warn the users about low detector coverage of a source, possible source confusion, a source position on known bad pixels, exceptionally large detection likelihood in a single image, and possible extended spurious sources.
No astrometric correction has been applied to the measured source positions. Their mean systematic error is estimated to be 0.43″ up to 0.74″, depending on its definition. This astrometric accuracy is better than that of uncorrected source positions listed in the 2XMM and 3XMM catalogues.
High-proper motion objects are not uniquely recovered by stacked source detection, because the algorithm is not designed to follow position changes between observations. They show up as several seemingly long-time variable objects in the catalogue and need to be identified manually or via comparison with astrometric catalogues.
Comprehensive information on
the catalogue columns and
the observations included in the stacked
catalogue is provided on separate websites.
Examples of the
auxiliary images are shown here.