
The auxiliary images for each catalogue source are available via the XSA interface provided by the ESA's XMM-Newton SOC. This page includes the complete set for an arbitrarily chosen source.
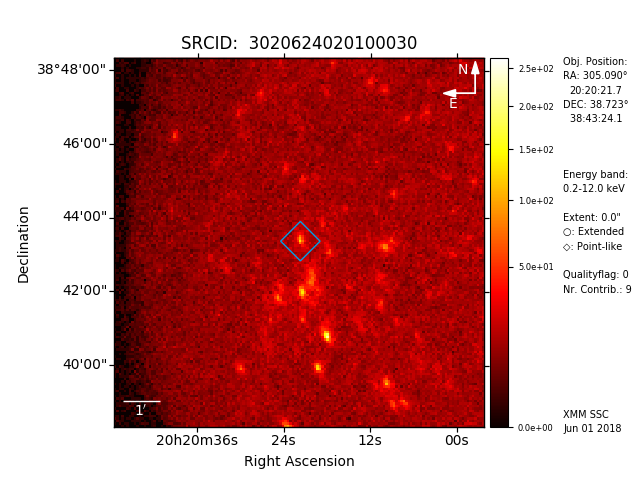
The broad-band X-ray image is created from a mosaic of all images between
0.2 and 12.0 keV and covers 10′×10′, centred at the
source position, in North-up East-left orientation. It is shown on a "heat"
colour scale with a square-root stretch and automatically chosen intensity
cuts. Extended sources are marked by a circle that scales with the source
extent, unresolved (point-like) sources by a box of fixed size. The image
legend informs about the source coordinate, extent, quality flag, and the
number of contributing pointings for which the source lies within the field
of view.
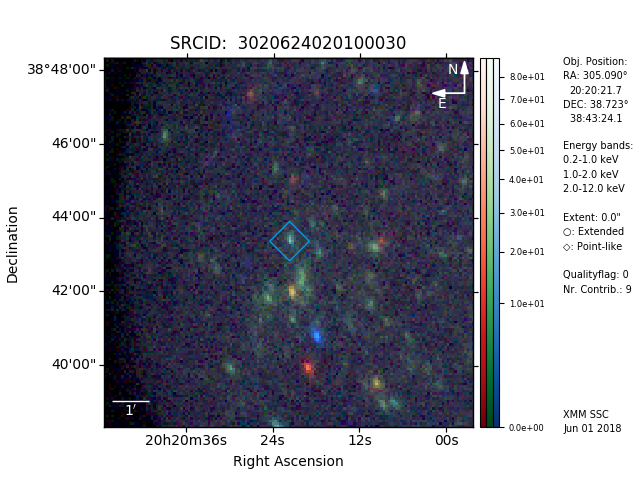
The colour-coded three-band image is created and scaled analogously to the
broad-band image using the red channel for the 0.2–1.0 keV band
(XMM-Newton energy bands 1 and 2), the green channel for the
1.0–2.0 keV band (XMM-Newton energy band 3), and the blue
channel for the 2.0–12.0 keV band (XMM-Newton energy bands 4 and
5).
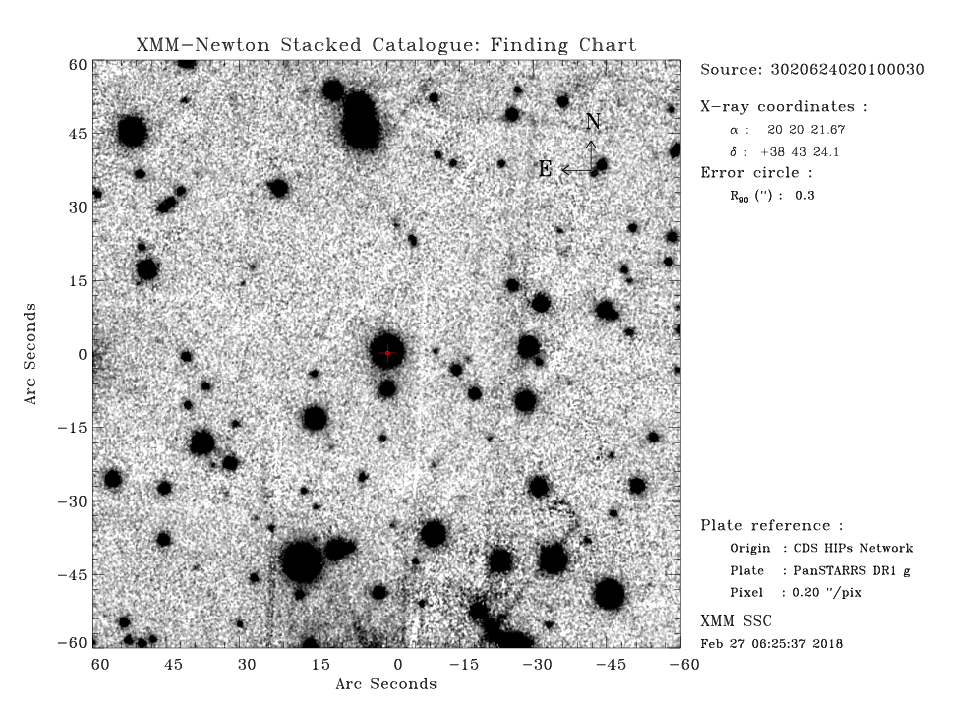
The optical finding chart has a side length of 2′ and is the
highest-quality image out of Pan-STARRS G, skyMapper G, and ESO Online
Digitized Sky Survey DSS2 blue and red band. It is generated using tools
based on the HiPS standard initially designed by the Astronomical Data
Center (CDS) of the Observatoire de Strasbourg and adopted by the Virtual
Observatory. The image cuts are tuned to highlight the fainter
features.

If the source has non-zero counts during at least two observations, a
long-term light curve is created from the stacked and the observation-level
mean EPIC fluxes. The legend informs about the source coordinate, extent,
quality flag, and the number of contributing pointings for which the source
lies within the field of view. Different plot symbols are used to indicate
tentative short- and long-term variability. The stacked flux is plotted with
a filled circle, if the variability VAR_PROB of the source fluxes to be
consistent with constant flux is 1% or lower. Probabilities of short-term
variability are included in 3XMM-DR7 for detections with at least 100 counts
and indicated in the long-term light curves by the plot symbols of the
fluxes calculated for each observation in the stacked catalogue. The flux is
plotted with a filled circle, if a 3XMM-DR7 observation has been associated
with the source in the stacked catalogue and if its short-term variability
flag VAR_FLAG_3XMMDR7 is true. Open circles are used in the opposite cases
for tentatively non-variable sources. Two additional plot symbols are
introduced for the flux per observation: an open box of arbitrary size, if
too few counts were collected during the observation to derive information
on short-term variability in 3XMM-DR7, and a small dot if no 3XMM-DR7
detection has been associated with the source.