User Guide to the Catalogue
This User Guide for XMMSL3 is an updated version of the documentation provided for the XMMSL2 version of the catalogue. The XMMSL2 documentation can be found here. This version refers directly to the full FITS and plain-text formats of
the XMMSL3 catalogue. Users interested in the details of changes to the data
processing since the XMMSL2 catalogue release, can refer directly to
section 12. Information about the columns contained in the XMMSL3
catalogue are presented in section 9. Brief summaries of some
elements of the XMMSL3 catalogue properties are provided in section
1.
Should you use the catalogue XMMSL3 for your research and publish the results, please use the acknowledgement below and cite Saxton et al., 2008.
This research has made use of data obtained from the XMM-Newton slew survey source catalogue compiled by the XMM-Newton Survey Science Centre consortium in collaboration with members of the XMM-Newton SOC and the EPIC consortium.
Contents
Summary
XMMSL3 is the third version of the XMM-Newton slew survey catalogue produced using the European Space Agency's (ESA)
XMM-Newton observatory slew data, and has been created by the XMM-Newton Survey
Science Centre (SSC) on behalf of ESA, building on previous work carried out by the XMM-Newton SOC. It is an incremental version of the XMMSL2 catalogue but contains 50% more observations than the previous version, including 8.5 additional years of data, using modified software and slightly revised screening methodology and therefore has been given a major version increment. XMMSL3 contains 1006 more
observations than XMMSL2 for a total of 3120 observations and 68383 more detections (for a total of 140735 detections).
XMMSL3 contains source detections drawn from a total of
3120 XMM-Newton EPIC pn slew observations made between 2000 August 26 and 2023 August 11.XMMSL3 contains 140735 X-ray detections above the
processing likelihood threshold of 8. These X-ray detections
relate to 116598 unique X-ray sources. A significant fraction of
sources (14966, 11%) have more than one detection in the catalogue (up to 78
repeat observations in the most extreme case).
The catalogue distinguishes between extended emission and point-like
detections. Parameters of extended detections are only reliable
up to the maximum extent measure of 80 arcseconds. There are 11352
detections of extended emission, of which 2357 are 'clean' (in the sense
that they were not flagged). Due to intrinsic features of the instrumentation as well as some
shortcomings of the source detection process, some detections are considered
to be spurious or their parameters are considered to be unreliable. It is
recommended to filter the catalogue on the VAL_FLAG column, keeping only those detections with the CLEAN_SAMPLE qualification to obtain a cleaned version of the catalogue. There are 46110 out of 140735 detections
that are considered to be clean.
The median flux in the total photon energy band
(0.2 - 12 keV) of the catalogue detections is
~ 2.7 × 10⁻¹² erg cm-2 s-1; in the soft energy band
(0.2 - 2 keV) the median flux is
~ 1.1 × 10⁻¹², and in the hard band
(2 - 12 keV) it is
~ 9.0 × 10⁻¹². The
median positional accuracy of the clean catalogue detections is
4.0 arcseconds.
1. Introduction
Slew observations with the XMM-Newton Observatory detect significant
numbers of previously unknown X-ray sources. The slew catalogue enhances our knowledge of the
X-ray sky and has the potential for advancing our understanding of the
nature of various Galactic and extragalactic source populations.
The XMMSL3 slew catalogue is the third publicly released XMM-Newton
slew survey source
catalogue. Versions XMMSL1 and XMMSL2 were produced by the XMM-Newton SOC and version XMMSL3 is produced by the XMM-Newton Survey Science Centre (SSC)
consortium, in collaboration with the SOC. The XMMSL3 catalogue is about twice the size of XMMSL2.
The catalogue contains detections drawn from a total of
3120 XMM-Newton EPIC pn slew observations made between 2000 August 26 and 2023 August 11. Not all slews made in this period have been used; slews with particularly high background throughout the slew or which gave processing problems have been rejected. A description of slew selection and initial processing is given in section 2. The slews have been processed separately in three energy bands
| Band |
Energy (keV) |
Description |
| 8 |
0.2-12 |
Total |
| 7 |
2-12 |
Hard |
| 6 |
0.2-2 |
Soft |
to form three distinct surveys which have been subsequently combined to form one catalogue.
The release includes two files, one fits and one csv. In previous versions a cleaned catalogue has been released, however for XMMSL3 we leave the user to filter the catalogue in the way that they wish to, but we recommend to filter the catalogue on the VAL_FLAG column, keeping only those detections with the CLEAN_SAMPLE qualification to obtain a cleaned catalogue. A full catalogue (xmmsl3_v1.0.fits), containing 140735 detections found with a likelihood of DET_ML>8. 46110 detections are considered clean.
There is an overlap between the slew paths, which has led to some sources being observed upto 78 times with 14966 sources being observed two or more times. The number of sources and the sky area for the whole catalogue is:
Full catalogue:
| Band |
Number detections |
| 8 |
101755 |
| 7 |
34789 |
| 6 |
58723 |
| ALL |
140735 |
The median flux in the total photon energy band
(0.2 - 12 keV) of the catalogue detections is
~ 2.7 × 10⁻¹² erg cm-2 s-1; in the soft energy band
(0.2 - 2 keV) the median flux is
~ 1.1 × 10⁻¹², and in the hard band
(2 - 12 keV) it is
~ 9.0 × 10⁻¹². All sources have been cross-correlated with existing astronomical catalogues and an identification assigned for each source where found. These have been included together with the source category, e.g. Galaxy, flare star etc., as columns in the catalogue together with any ROSAT All Sky Survey (RASS) counterpart. 64792 detections have an identification.
Below are the positions of the slew sources in Galactic coordinates. They have been scaled to show the brightest to weakest sources.
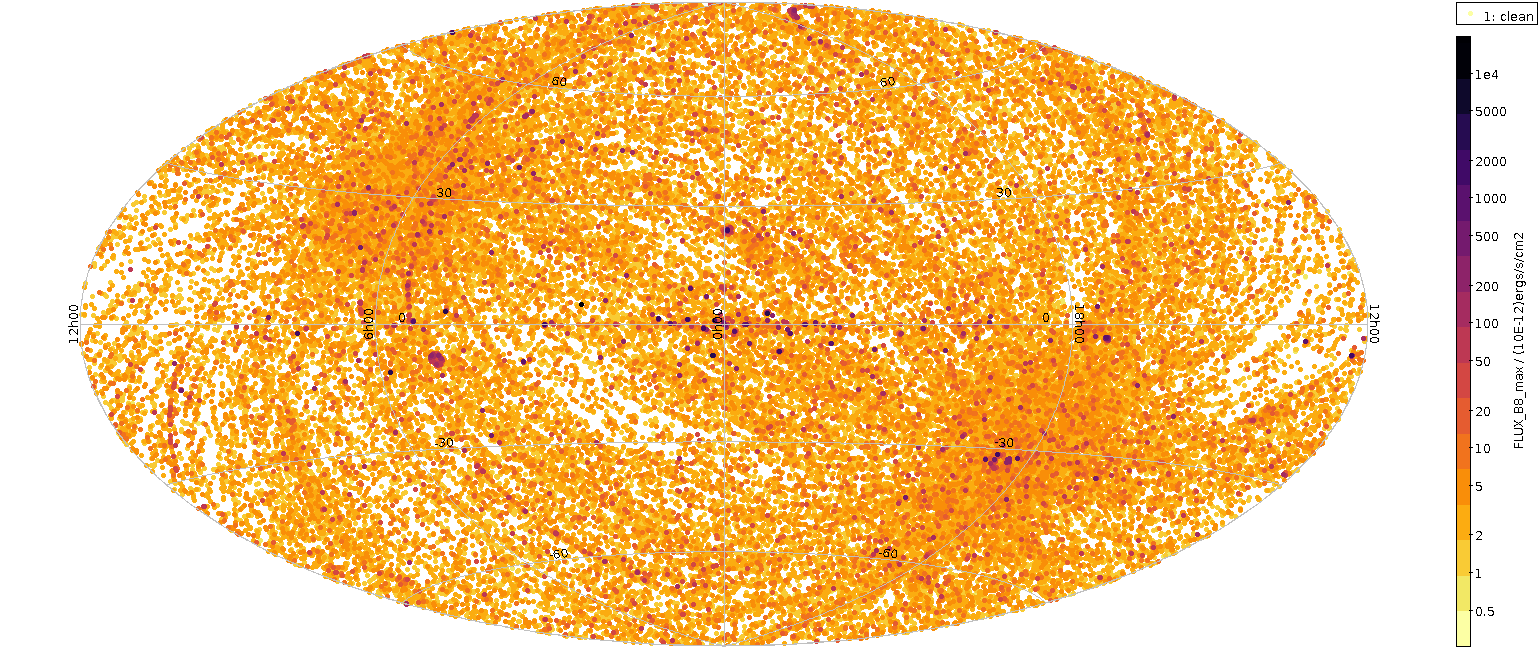
Figure 1 Clean XMMSL3 sources shown in Hammer-Aitoff projection in Galactic coordinates. Light to dark colours indicate low to high flux sources. Many of the brightest sources are in the Galactic plane, as they are at only a few kiloparsecs.
2. Initial Processing
The XMM-Newton Slew Data Files (SDFs) for EPIC-pn were processed using the odfingest and epproc packages. The data included in XMMSL3 were processed with the SAS version 15 and all other versions since then as this is an incremental version. For diagnostic reasons a few parameters were set to non-default values (e.g. keeping also events below 150 eV). For the Slew Survey catalogue only EPIC-pn exposures performed in Full Frame (FF), Extended Full Frame (eFF), and Large Window (LW) modes were selected, i.e. modes where all 12 CCDs are integrating (in LW mode only half of each CCD). The corresponding cycle times are 73.36 ms, 199.19 ms, and 47.66 ms, which converts to a scanned distance of 6.6 arcseconds, 17.9 arcseconds, and 4.3 arcseconds per cycle time, respectively. In the Small Window mode only the central CCD is operated and a window of 64 x 64 pixels is read out, i.e. only about 1/3 of a CCD. In the fast modes, Timing and Burst, only 1-dimensional spatial information for the central CCD is available and thus these three modes are not very well suited for source detection.
3. Processing
Events are recorded initially in RAW or detector coordinates and have to be transformed, using the satellite attitude history, into sky coordinates. The tangential plane geometry commonly used to define a coordinate grid for flat images is only valid for distances of 1-2 degrees from a reference position, usually placed at the centre of the image. To avoid this limitation, slew datasets are divided into roughly one square degree event files, attitude corrected and then converted into images.
An overlap of about 20% has been allowed between subimages to avoid problems with sources which lie at the edge of a subimage.
Source searching uses a semi-standard
'eboxdetect (local) + emask + esplinemap + eboxdetect (map) + emldetect'
method, tuned to about zero background, and performed on a single image containing just the single events (pattern=0) in the 0.2-0.5 keV band, plus single and double events (pattern=0-4) in the 0.5-12.0 keV band.

Image of a typical XMM slew
4. Combination of individual band surveys
Detections in the three energy bands have been combined using a match radius of 30 arcseconds to identify sources detected in more than one band. The match radius is approximately 4 sigma and is reasonable for point sources because of the scarcity of sources (1 detection per square degree on average) at the flux levels probed by the slew survey.
5. Spurious flagging
Spurious detections are produced due to systematic effects with the instruments and detection software. These sources have been screened and flagged ('t' for 'true' or 'f' for 'false') in the different categories described below. When a source is flagged true, a more detailed explanation of the problem for each particular source can appear in the FLAG_COMMENT column.
VER_INEXT:
This quality flag is used to ensure that only one source is quoted for extended objects; that with the highest det_ml. Two different cases have been found:
- Large extended sources (mainly SNR) that often result in multiple detections of the same object. These have been identified by searching for images with a large number of sources
- Other spurious sources (mainly due to Cluster of Galaxies) appear because the technique used for merging detections in the different energy bands is optimal for point-like sources. This consists of considering the same source if their centres lie within 30 arcsec of each other, but this offset has to be bigger for extended sources. This flag has been set to 't' for 2535 detections.
VER_HALO:
A halo of false detections is often seen around bright slew sources due to the imperfect modelling of the PSF (a problem also found in the creation of the 4XMM Serendipitious Source Catalogue). Due to the reduced exposure time in slew observations this is only important for very bright sources, rate>>10c/s. For flagging this category of spurious, the different sources detected in the same image and containing a very bright source have been inspected. If their centres lie within 30 arcsec but corresponding to the same object, the one with highest det_ml is taken as the non-spurious detection and the rest have been flagged 't'. 1843 detections have this flag set.
VER_HIGHBGND:
One of the characteristics of slew exposures is their low background (of average ~0.1 c/arcmin2). Solar flares may be present however, and can generate high background sub-images which aren't above the threshold used to exclude them. Sources which fall in these patches of high background have been identified and flagged in this category by looking for images with a large number of sources (without being included in the VER_INEXT category of spurious sources explained above). It has been checked that no other bright off-axis source could generate the detections. There are 19981 detections with this flag set to 't'.
VER_NREDG:
In the previous catalogue some sources were detected lying on the border of consecutive images of the same slew observation. This no longer occurs and this flag has not been used in XMMSL2 or XMMSL3.
VER_PSUSP:
This quality flag is related to the astrometry performance and arises after a careful visual examination of the Raw Attitude Files (RAF). The attitude reconstruction of some slews appears to be "turbulent" rather than smooth, so source positions lying in these poorly attitude reconstructed regions are likely to be inaccurate. 1088 detections have this warning flag set to 't'
VER_FALSE:
This flag is related to spurious detections not included in the other flags. Examples are cosmic rays, out of field-of-view reflections from SCO X-1 or other bright sources, bad attitude files or bad exposure time. 389 detections have this flag set to 't'.
VER_OPTLOAD:
This is a warning flag which says that most of the events associated with this source have been removed by filtering. This can be a good indication that the detection has been spuriously created by optical photons. It can also indicate that the source extraction region includes an image defect (such as a bad pixel) or that the source is extremely soft, e.g. a white dwarf. This flag should be used in conjunction with knowledge of the optical magnitude of the object. 377 sources have this flag set to 't'.
6. Identifications
All sources detected in the survey have been correlated with different catalogues in order to identify the XMM-Newton slew sources with previously known objects.
The search for counterparts uses the following catalogues and databases in the listed order.
| Catalogue |
Search Radius (arcsec) |
| SIMBAD |
12 |
| Abell galaxy clusters |
180 |
| Zwicky galaxy clusters |
180 |
| Einstein IPC |
120 |
| EXOSAT slew |
45 |
| Rosat all-sky survey |
90 |
| Rosat pointed PSPC observations (2RXP) |
30 |
| Rosat pointed HRI observations (1RXH) |
30 |
| Integral source catalogue (IGR) |
60 |
| XMM-Newton serendipitous survey (4XMM) |
12 |
| NED |
12 |
Counterparts have been allocated depending on where they are found, with identifications in SIMBAD given the greatest precedence and NED the least. The one exception is sources found in the Abell or Zwicky catalogues which are extended in the slew catalogue (EXT_B6>0.5 or EXT_B7>0.5 or EXT_B8>0.5). These have been assigned the Abell or Zwicky counterpart name rather than that given in SIMBAD.
The cross-correlation with the ROSAT all sky survey was split into two. Bright source catalogue (BSC) sources have been matched to a radius of 1 arcminute and the faint source catalogue (FSC) sources to 1.5 arcminutes. Of the clean catalogue slew sources, 59% have a ROSAT counterpart. This increases to 69% if we consider only sources with a soft band (B6) detection.
Results from the identification process appear in the final catalogue in the columns:
IDENT: name of the source
ALTIDENT: alternative name of the source
ID_DIST: distance in arcseconds between the slew source and the identification.
ID_CATEGORY: type of the identified source that, when existing, has been extracted from the catalogues (it is not very homogeneous because type convention is very variable between and sometimes within catalogues)
RASSNAME: the closest RASS match
RASSDIST: distance in arcseconds to the closest RASS match.
Given the statistical nature of the identification process these should be regarded as suggested rather than definitive counterparts.
7. Astrometry
The attitude information of the XMM-Newton satellite is provided by the Attitude and Orbit Control Subsystem (AOCS). A star tracker co-aligned with the telescopes allows up to a maximum of five stars to be continuously tracked giving accurate star position data every 0.5 seconds, which operates in addition to the Sun sensor that provides a precise Sun-line determination. Such information is processed resulting in an absolute accuracy of the reconstructed astrometry of typically 1 arcsecond during pointed observations. For the open-loop slews, large slews outside the star-tracker field of view of 3 x 4 degrees, the on-board software generates a three axis momentum reference profile and a two-axis (roll and pitch) Sun-sensor profile, both based on the ground slew telecommanding. During slew manoeuvring a momentum correction is superimposed onto the reference momentum profile and, as there are no absolute measurements for the yaw axis, a residual yaw attitude error exists at the end of each slew that may be corrected in the final closed-loop slew. To process slew data, attitude information is taken from a Raw Attitude File (RAF) which stores attitude points every 40-60 seconds. The times quoted in the RAF are offset from spacecraft time by 0.75 seconds, which has to be corrected in the software, otherwise a 1 arcminute offset in source positions is seen along the slew direction. Initially the correction was performed in the slew specific software but from SAS 7.0 has been included in the general SAS software. The SAS astrometry software interpolates between the rather sparse RAF points using a curve fit. Several RAFs have been found to contain one or more bad attitude points which are sufficient to totally corrupt the attitude solution over a considerable section of the slew. In other slews a part or all of the attitude seems to be turbulent rather than smooth. It is not known why this occurs and no attempt to fix it has been made. Sources affected by these attitude problems have a position suspect (VER_PSUSP) flag set to true. The error introduced in the source positions can be of the order of 1 arcminute.
A sample of 16281 non-extended sources from the clean catalogue with matches in the ROSAT all-sky survey have been cross-correlated with the WISE catalogue (Cutri et al. 2012). A histogram of the positional offsets is shown below. The distribution has a 1-sigma offset of 7.1 arcseconds and 90% of the matches lie within 11.3 arcseconds.

A histogram of the offsets between point sources with a RASS counterpart in the clean catalogue and the closest WISE survey counterpart
8. Reliability
By comparing positions of a well constructed sample of reliable slew sources with the WISE catalogue it was found that 90% have a WISE match within 11.3". We can use this to gauge the reliability of other sub-samples of sources. In the table below we look at the effect of varying detection likelihood on the percentage of sources which is found in WISE within the 11.3" radius. Only point sources (extension parameter < 1.0), which are not flagged as BAD, and where the number of counts > 4 in at least one of the bands, have been used.
| Band |
MIN_DET_ML |
Nsample |
Percentage |
| Total |
|
|
|
| 8 |
10.5/15.5 |
24993 |
83.3 |
| 8 |
15.5 |
17155 |
89.7 |
| Hard |
|
|
|
| 7 |
10.5/15.5 |
2975 |
68.7 |
| 7 |
15.5 |
1601 |
81.4 |
| Soft |
|
|
|
| 6 |
10.5/15.5 |
21197 |
86.6 |
| 6 |
15.5 |
17321 |
89.8 |
| ALL bands |
|
|
|
| 6,7 or 8 |
10.5/15.5 |
28285 |
81.2 |
| 6,7 or 8 |
12.0/15.5 |
25668 |
84.0 |
| 6,7 or 8 |
13.0/15.5 |
24036 |
85.5 |
| 6,7 or 8 |
14.0/15.5 |
22512 |
86.8 |
| 6,7 or 8 |
15.5 |
20393 |
88.3 |
MIN_DET_ML represents the minimum detection likelihood for low background images (first number) and high background images (second number) or for both if just one number, where a low background image is defined as having IMAGE_BG_RATE<=3.0. A full assessment of the spurious content of the catalogue has not yet been made. The table above gives an indication of the reliability of samples based on different cuts in the detection likelihood compared with a sample with a ROSAT counterpart which is assumed to be free of spurious sources. The statistical error in the XMM-Newton slew position has been ignored in the matching process and so it is natural that the lower significance sources should have a lower match rate. Nevertheless, the hard band (band 7) lower significance sources have a particularly low match rate with WISE within 11.3" and for this reason the CLEAN sample has been re-defined to exclude sources with DET_ML_B7<15.5 which are not positively detected in the total or soft bands.
9. Column Descriptions
UNIQUE_SRCNAME
This is the official name for sources detected in the XMM-Newton slew survey. It starts with the prefix, XMMSL3 (evolving from XMMSL1 and XMMSL2 the IAU registered designator), and then encodes the J2000 sky position, e.g. XMMSL3 J010537.6+364858. The name is assigned in two passes. When the three independent energy band source lists are combined to form one catalogue the source name is set using the position in the band where the DET_ML likelihood is the highest. A second pass is then performed such that sources which have been observed in more than one slew are given the same name. Again, priority is given depending on the detection likelihood. Note that the combination of UNIQUE_SRCNAME and observation number (OBSID) is unique. Detections are deemed to be from the same source if their centres lie within 30 arcseconds of each other. Note that the statistical position error (RADEC_ERR) calculated by the source search software is not used in this calculation. This is because the systematic error on the slew attitude reconstruction dominates the error budget in many cases. Given the scarcity of slew sources on the sky, 30" was found to be a reasonably robust match radius for point sources. It is not so good for extended sources and the catalogue may contain multiple detections of the same extended source with different names.
OBSID
This is the observation number assigned to the slew by the satellite scheduling system. Slew observations always begin with a 9 to distinguish them from pointed observations, followed by a 4 digit satellite orbit number and a 5 digit slew designator, e.g. 9031400004, refers to the second slew of revolution 314.
SOURCENUM
This is a number which uniquely identifies each detection in an observation.
RA, DEC
The J2000 right ascension and declination of the source.
Units: Degrees
In the event of a detection in more than one energy band, the coordinates are taken from the band with the highest detection likelihood.
RADEC_ERR
The statistical error on the source position as returned by the source detection software.
Units: arcseconds
LII, BII
The galactic coordinates of the source.
VAL_FLAG
A text string which is set to 'CLEAN_SAMPLE' if this source is included in the clean subset.
Units: Degrees
HR1
The hardness ratio, defined as
HR1 = (rate_b7-rate_b6)/(rate_b7+rate_b6)
where rate_b7 is the hard band count rate and rate_b6 is the soft band count rate. This has been calculated for the 2921 sources which have a positive detection in both bands.
HR1_ERR
Error on the hardness ratio calculated as:
sqrt(rate_b7_err*rate_b7_err + rate_b6_err*rate_b6_err) /(rate_b7+rate_b6)
where rate_b7_err and rate_b6_err are the errors on the hard and soft band count rates respectively.
DATE_OBS, DATE_END
The start and end times of the slew containing this source.
Format is: Year-Month-dayThours:minutes:seconds, e.g. 2004-07-12T14:23:16
SCTS_B8
The number of background subtracted counts, in the total energy band (0.2-12 keV).
Units: counts
This number has been corrected for photons scattered outside the source region due to the Point Spread Function (PSF).
SCTS_B8_ERR
Statistical 1 sigma error on the total band source counts.
SCTS_B7
The number of background subtracted counts, in the hard energy band (2-12 keV), corrected for the PSF. Units: counts
SCTS_B7_ERR
Statistical 1 sigma error on the hard band source counts.
SCTS_B6
The number of background subtracted counts, in the soft energy band (0.2-2 keV), corrected for the PSF. Units: counts
SCTS_B6_ERR
Statistical 1 sigma error on the soft band source counts.
X_IMA_B8, Y_IMA_B8
The X and Y position of the source in the total band image in image pixels.
Units: 4.1"x4.1" pixels
X_IMA_B7, Y_IMA_B7
The X and Y position of the source in the hard band image in image pixels.
Units: 4.1"x4.1" pixels
X_IMA_B6, Y_IMA_B6
The X and Y position of the source in the soft band image in image pixels.
Units: 4.1"x4.1" pixels
EXT_B8
The spatial extension of the source in the total energy band.
Units: 4.1"x4.1" image pixels
This measures the deviation from a point source of the spatial distribution of the source counts. It is defined as the sigma of a Gaussian which would need to be convolved with the point spread function (PSF) to produce the observed counts distribution. The software (emldetect) fits sources out to a maximum extent of 20 pixels.
EXT_B8_ERR
Statistical one sigma error on the total band extension parameter.
EXT_B7
Spatial extension of the source in the hard energy band. Units: 4.1"x4.1" image pixels
EXT_B7_ERR
Statistical one sigma error on the hard band extension parameter.
EXT_B6
Spatial extension of the source in the soft energy band.
Units: 4.1"x4.1" image pixels
EXT_B6_ERR
Statistical one sigma error on the soft band extension parameter.
DET_ML_B8
The detection likelihood in the total (0.2-12 keV) energy band.
DET_ML_B7
The detection likelihood in the hard (2-12 keV) energy band.
DET_ML_B6
The detection likelihood in the soft (0.2-2 keV) energy band.
EXT_ML_B8
Likelihood of the source being extended in the total band.
EXT_ML_B7
Likelihood of the source being extended in the hard band.
EXT_ML_B6
Likelihood of the source being extended in the soft band.
BG_MAP_B8
Background value for the total band.
Units: Counts per pixel
BG_MAP_B7
Background value for the hard band.
Units: Counts per pixel
BG_MAP_B6
Background value for the soft band.
Units: Counts per pixel
EXP_MAP_B8
The effective on-axis exposure time in the total energy band.
EXP_MAP_B7
The effective on-axis exposure time in the hard energy band.
EXP_MAP_B6
The effective on-axis exposure time in the soft energy band.
FLUX_B8
The source flux in the total energy (0.2-12 keV) band.
Units: 10-12 erg s-1 cm-2
Derived for an absorbed power-law spectrum of slope 1.7 and nH=3.0 x 1020 cm-2
FLUX_B8_ERR
The error on the total band source flux
FLUX_B7
The source flux in the hard energy (2-12 keV) band.
Units: 10-12 erg s-1 cm-2
Derived for an absorbed power-law spectrum of slope 1.7 and nH=3.0 x 1020 cm-2
FLUX_B7_ERR
The error on the hard band source flux.
FLUX_B6
The source flux in the soft energy (0.2-2 keV) band.
Units: 10-12 erg s-1 cm-2
Derived for an absorbed power-law spectrum of slope 1.7 and nH=3.0 x 1020 cm-2
FLUX_B6_ERR
The error on the soft band source flux.
RATE_B8
The total band count rate
Units: counts/second
RATE_B8_ERR
The error on the total band count rate
RATE_B7
The hard band count rate
Units: counts/second
RATE_B7_ERR
The error on the hard band count rate
RATE_B6
The soft band count rate
Units: counts/second
RATE_B6_ERR
The error on the soft band count rate
RA_B8, DEC_B8
The J2000 celestial position of the total band source.
RADEC_B8_ERR
The statistical error on the total band position.
RA_B7, DEC_B7
The J2000 celestial position of the hard band source.
RADEC_B7_ERR
The statistical error on the hard band position.
RA_B6, DEC_B6
The J2000 celestial position of the soft band source.
RADEC_B6_ERR
The statistical error on the soft band position.
LII_B8, BII_B8
The galactic position of the total band source.
LII_B7, BII_B7
The galactic position of the hard band source.
LII_B6, BII_B6
The galactic position of the soft band source.
VAL_FLAG
A text string which is set to 'CLEAN_SAMPLE' if this source is included in the clean subset (no flags set for the source).
SRCNAME_B8
The source name defined in the total band list. The format is 'xs' followed by the revolution number, the observation ID and the source position, e.g. xs0841_9084100002_12:57:07.5+01:50:42
SRCNAME_B7
The source name defined in the hard band list. The format is 'xs' followed by the revolution number, the observation ID and the source position, e.g. xs0841_9084100002_12:57:07.5+01:50:42
SRCNAME_B6
The source name defined in the soft band list. The format is 'xs' followed by the revolution number, the observation ID and the source position, e.g. xs0841_9084100002_12:57:07.5+01:50:42
XIMNAME_B8
The name of the image containing the total band detection.
XIMNAME_B7
The name of the image containing the hard band detection.
XIMNAME_B6
The name of the image containing the soft band detection.
VER_INEXT
If set true, this flag notes that a detection has been found within an extended source and is probably false. This flag is used to minimise the number of sources quoted for the large supernova remnants, for example.
VER_HALO
If set true, this flag indicates that a detection lies within the point spread function, or halo, of a very bright source and is probably spurious.
VER_HIBGND
If set true, this flag indicates that the source lies within a bright region, caused by high background, and is probably spurious.
VER_NREDG
Not used in XMMSL3.
VER_PSUSP
This flag indicates that the quoted position of the source is likely to be inaccurate. In a few slews the attitude reconstruction is poor and in these cases the actual position of the source is difficult to determine and can be wrong by an arcminute.
VER_FALSE
This is a catch-all for problems not included in the other flags. In the catalogue 389 detections have this flag set true. Reasons include: the exposure time has been calculated as zero, a detection due to a very bright source, e.g. SCO X-1, out of the field of view, a possible cosmic ray or a very bad attitude reconstruction.
FLAG_COMMENT
A comment which explains why a particular source flag has been set to true.
IDENT
Cross-correlations of the positions of the slew sources with astronomical databases and catalogues have been performed (see section on IDs). This column gives the catalogue name of the best match.
ALTIDENT
An alternative name for the best match source.
RASSNAME
The name of the closest Rosat All Sky Survey (RASS) source.
ID_CATEGORY
The source type as returned by SIMBAD, NED and the other resources used in the cross-matching process. This is directly taken from the catalogue in question and no attempt has been made to rationalise the values.
ID_RESOURCE
The astronomical database or catalogue from which the best match has been selected. e.g. SIMBAD, NED, etc.
ID_DIST
The distance in arcseconds between the best match candidate and the slew survey source.
Units: arcminutes
RASS_DIST
The distance from the best match ROSAT source and the slew source. Units: arcseconds
MODE_ID
Observing mode of the EPIC-pn camera. FF= Full frame mode eFF = extended full frame mode LW = large window mode
IMAGE_BG_RATE
Peak background count rate in the image from which the source was extracted. This is measured as the count rate, over the whole image, for events with energy > 10 keV (PI>10000). Units: counts/second. It is quoted to a resolution of 0.1 c/s and is used to determine the overall background environment in which a source was detected. This value is used in the creation of a clean subsample of the catalogue (see top level description). Generally, the higher this value, the greater the probability that the source is spurious. This is especially true if the detection likelihood of the source is less than 15.5. The value has been tabulated for images with a background rate greater than 2 c/s. For quieter images the value has been artifically set to 1.9 c/s.
MJD_START
The start time of the subimage where the source is located in modified Julian date (MJD).
MJD_STOP
The end time of the subimage where the source is located in MJD.
VER_OPTLOAD
A warning flag indicating that the source may suffer from optical loading.
FILT_COUNTS
The number of counts found within a 1 arcminute radius about the source position after standard filtering is applied.
UNFILT_COUNTS
The number of counts found within a 1 arcminute radius about the source position with no filtering applied.
US_XMMSL1
The name of the same source in the XMMSL1 catalogue if existing.
US_EXTRAS
XMMSL2 made use of work carried out within the framework of the EXTraS project. XMMSL2 is closely linked to the long-term variability (LTV) catalogue within EXTraS, and this US_EXTRAS column provides the corresponding SRCID value within the EXTraS LTV catalogue. Only detections included in XMMSL2 are have a potential value in this column.
10 Detection Limits
The minimum detectable count rate for a given band is ~0.4 c/s, for a source which passes through the centre of the detector and for typical background levels. A rough flux upper limit is then available by multiplying this count rate by the conversion factors specified below. This is for each band:
| Band |
Energy (keV) |
Flux limit (10-12 ergs/s/cm2) |
| Total |
0.2-12 |
1.3 |
| Hard |
2-12 |
3.7 |
| Soft |
0.2-2 |
0.57 |
11 Flux Conversion
Source fluxes have been calculated from count rates based on energy conversion factors assuming a spectral model of an absorbed power-law with Nh = 3.0 x 1020 cm-2 and slope = 1.7 (see XMM Survey Science Centre memo, SSC-LUX TN-0059 for a general description of the technique). The energy conversion factors used here are:
| Band |
Conv factor |
| Total |
3.159 |
| Hard |
9.144 |
| Soft |
1.436 |
and convert between the source count rate (c/s) to flux in these energy bands in units of 1 x 10-12 ergs s-1 cm-2
12 Differences between XMMSL3 and XMMSL2
XMMSL3 is an incremental catalogue that builds on the XMMSL2 catalogue, adding 8.5 years of data and doubling the number of detections. However, due to significant differences between the two versions, the major version number has been incremented. These differences are due to the new data being reduced with newer pipeline versions (eight different pipelines in total) and are detailed below.
Revised version of source detection algorithm (emldetect v.6.02 --> v.7.6.2)
Since XMMSL2, there have been a number of revisions made to the source detection tasks and notably to the SAS task emldetect. All detections are tested for their potential spatial extent during the fitting process. The instrumental point-spread function (PSF) is convolved with a β extent model, fitted to the detection, and the extent likelihood is calculated as described by Section 4.4.4 of Watson et al. 2009). A detection is classified as extended if its core radius (of the β-model of the PSF), rc > 6 arcsec and if the extended model improved the likelihood with respect to the point source fit such that it exceeded a threshold of Lext,min = 4. In the XMMSL2 version, when a detection was identified as pointlike, the extent maximum likelihood (EXT_ML_B6, EXT_ML_B7 or EXT_ML_B8) was set to -999. Since version 7.5.2, a negative maximum likelihood is attributed to point-like detections. Lext,min ≥ 4 indicates that a source is probably extended, whilst
negative values indicate a clear preference of the point-like over the
extended fit. A minimum likelihood difference
of four has been chosen to mark a detection as extended. This threshold
makes sure that the improvement of the extended over the point-like fit is
not only due to statistical fluctuations but from a more precise description
of the source profile. Where no detection in a particular band has been made, there is no extension maximum likelihood that is provided. Therefore, the extension maximum likelihood column is composed of positive and negative values, as well as the value -999 and nulls.
Manual screening and the clean catalogue
Manual screening is carried out for every observation in the incremental part of the XMMSL3 version of the catalogue. This results in many more of the observations being flagged with high background, but still included in the catalogue.
In previous versions of the slew catalogue, two files were provided, one with the whole catalogue of detections and another with the detections considered as clean according to the criteria: more than 4 background-subtracted counts in either the full, soft or hard bands and the detection likelihood > 10.5 in one of the bands in detections found in low background subimages or detection likelihood > 15.5 in sources found in any subimage. In line with the other catalogues produced by the XMM-SSC, only one catalogue version is produced for XMMSL3 which includes all detections. To create a 'cleaner' version of the catalogue, the recommended method is by filtering the catalogue on the VAL_FLAG column, keeping only those detections with the CLEAN_SAMPLE qualification. This results in 46110 detections out of the 140735 detections (one third). This criteria is slightly stricter than the previous criteria, where approximately two fifths (40%) of the catalogue was considered clean.
13 References
- "The first XMM-Newton slew survey catalogue: XMMSL1"
R.D. Saxton, A.M. Read, P. Esquej, M.J. Freyberg, B. Altieri, D. Bermejo
2008, A&A 480, 611
- "EPIC-pn SLEW-specific PSF parameterisation"
A.M. Read, R.Saxton
XMM-SOC-CAL-SRN-0333
- "Optical loading in the XMM-Newton slew source catalogue"
R.D. Saxton, A.M. Read, J. Robrade, J.H.M.M. Schmitt
XMM-SOC-CAL-TN-0210
Acknowledgements
The identification process has made considerable use of the Vizier catalogue access tool, CDS, Strasbourg, France. The original description of the VizieR service was published in A&AS 143, 23. It has used the SIMBAD database, operated at CDS, Strasbourg, France and the NASA/IPAC Extragalactic database (NED) which is operated by the Jet Propulsion Laboratory, California Institute of Technology, under contract with the National Aeronautics and Space Administration.
If the XMMSL3 catalogue has been helpful for your research the following acknowledgment would be appreciated:
This research has made use of data obtained from the XMM-Newton slew survey source catalogue compiled by the XMM-Newton Survey Science Centre consortium in collaboration with members of the XMM-Newton SOC and the EPIC consortium.


This project has received funding from the European Union's Horizon 2020 research and innovation programme under grant agreement n°101004168, the XMM2ATHENA project.
Document revision history
| Release No. |
Release Date |
Comments |
| 1.0 |
19th February 2025 |
First release for XMMSL3 |
Appendices
A1. Known problems and other issues
Please read the Watchouts section of the XMMSL3 documentation for the latest information on XMMSL3 catalogue issues.
A.2 Catalogue pipeline processing details
XMMSL3 data was reduced with various pipeline : versions 15 to 19 pipeline release notes.