 |
 |
 |
 |
 |
 |
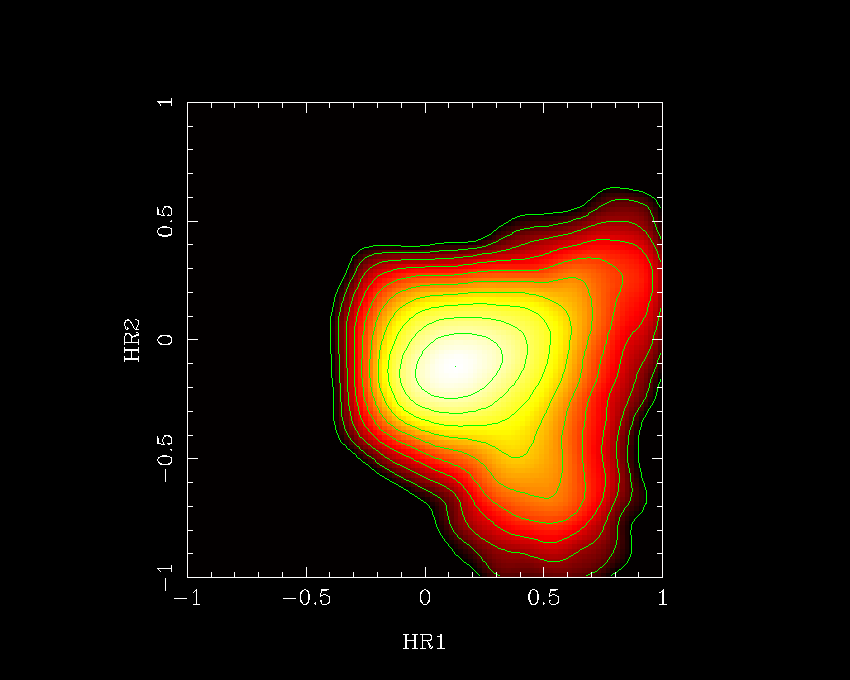
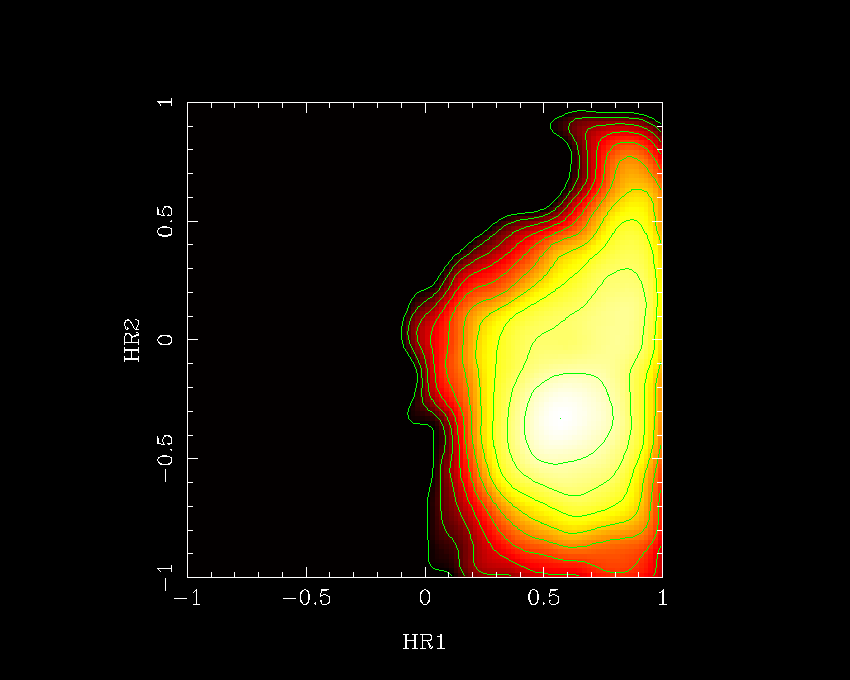
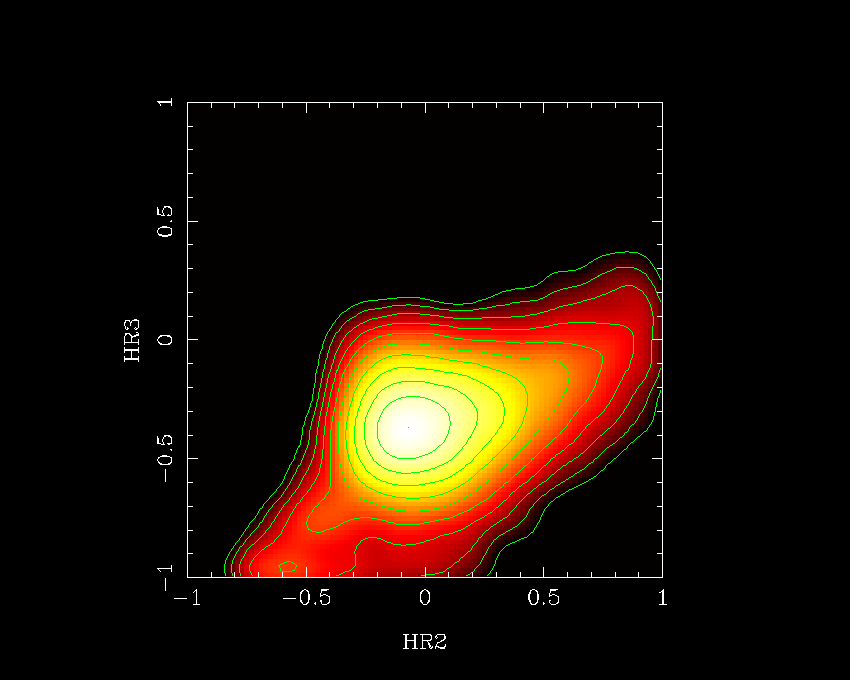
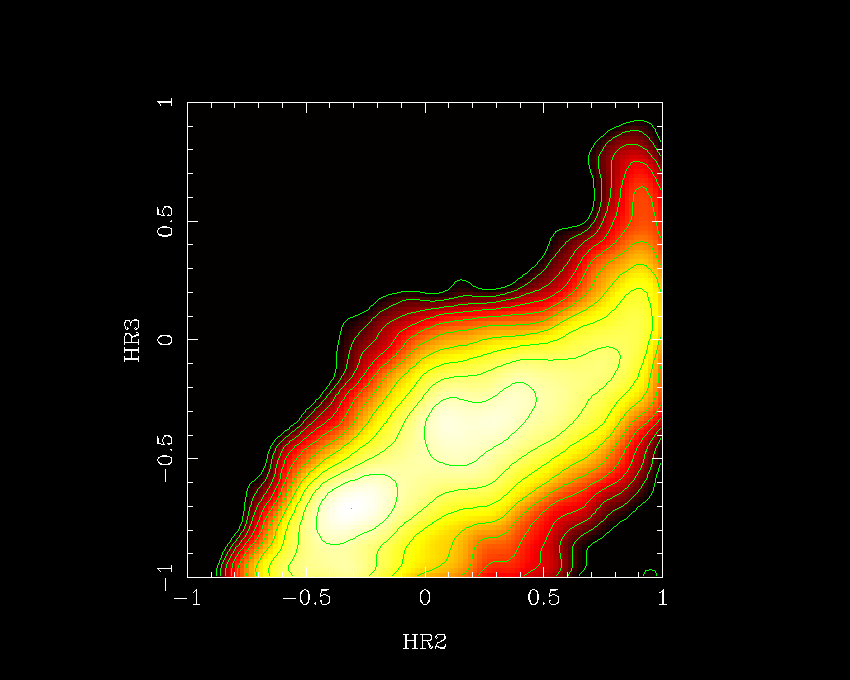
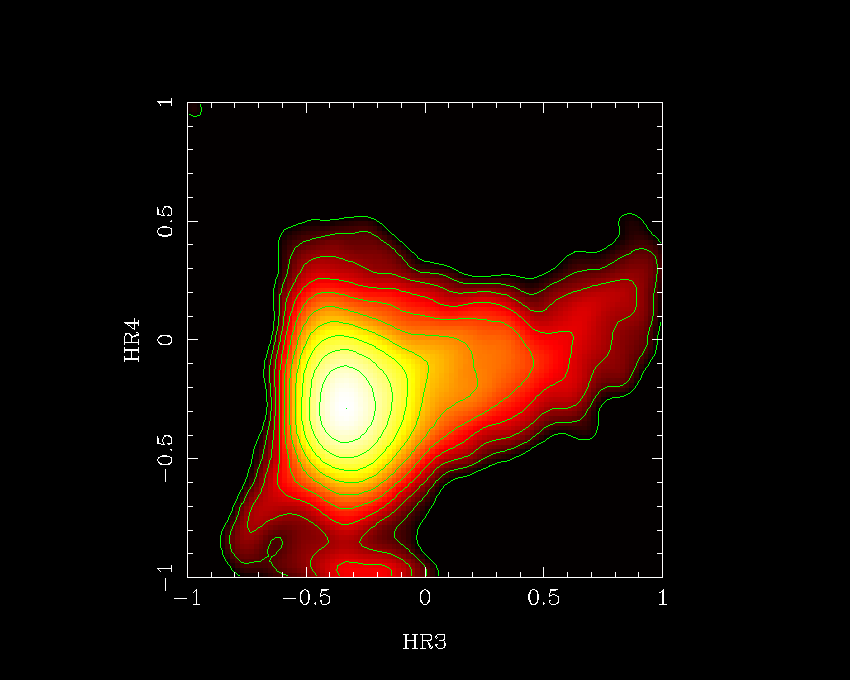
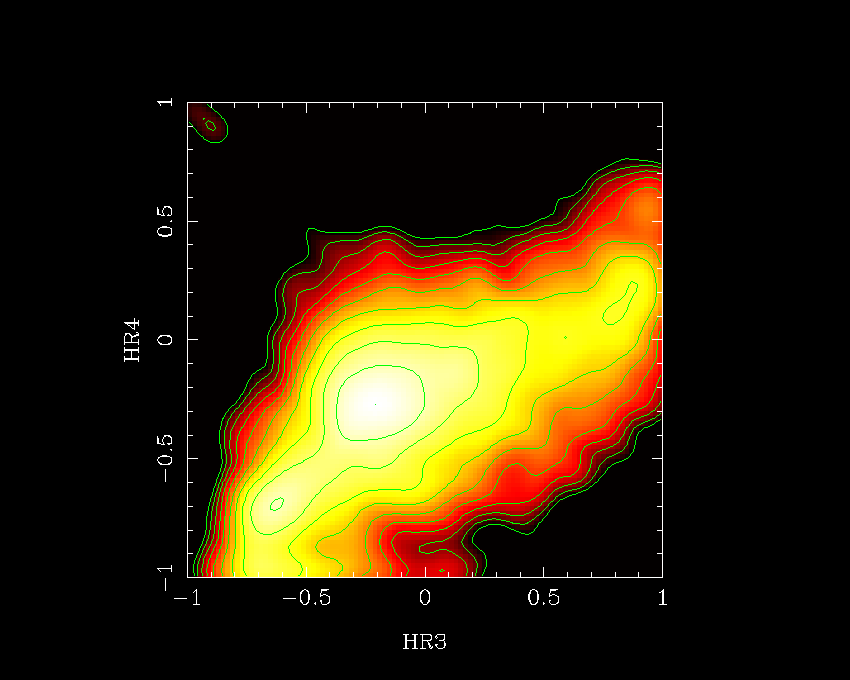
Figure 5.9: X-ray colour - colour (hardness ratio) distributions for detections with PN total band detection likelihood > 10. Only sources with errors in the hardness ratios < 0.2 have been used.
From top to bottom are shown HR1 vs HR2, HR2 vs HR3 and HR3 vs HR4. Left: distributions for detections at high Galactic latitude (|b| > 20 degrees); right: distributions for detections at low Galactic latitude (|b| < 20 degrees). The plots show the smoothed density of hardness ratio values in a logarithmic representation with contours (regions spaced 0.2 units in logarithmic scale of intensity) overlaid.