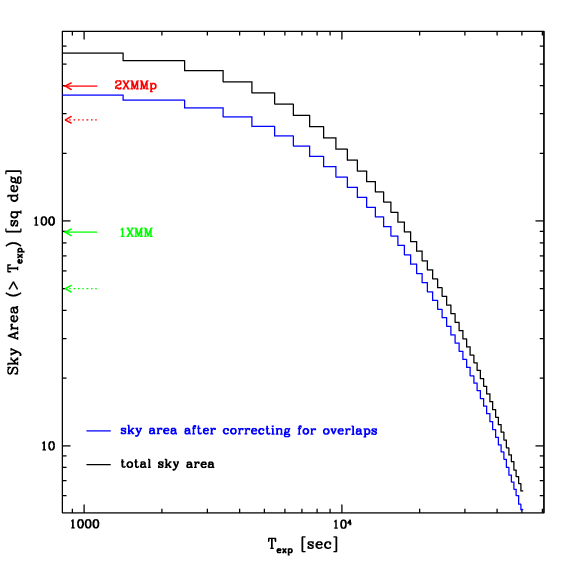
Figure 5.4: Sky area as a function of net exposure time for 2XMM catalogue fields. The black histogram shows the total sky area without corrections for field overlaps, while the blue histogram shows the 'actual' sky area corrected for field overlap. Arrows indicate the total sky areas of the 2XMMp (red) and 1XMM (green) catalogues, without (solid line) and with (dashed line) corrections.