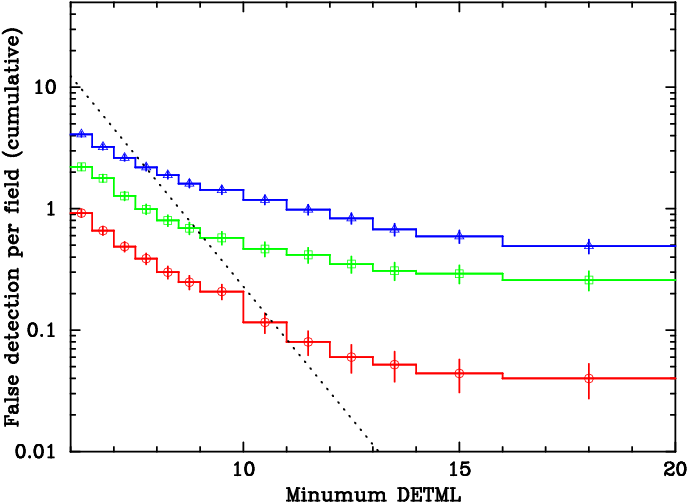
Figure 5.6: The number of false detections per field as derived by simulations for typical high Galactic latitude fields as a function of detection likelihood limits for various exposure times. The red circles show the results for exposures of 12 ks for MOS and 8 ks for PN (~ 70% of the median values), whereas the green squares and blue triangles present 3 and 10 times higher exposure times, respectively. The dotted line represents the theoretical false detection number assuming 5000 independent detection cells per field.