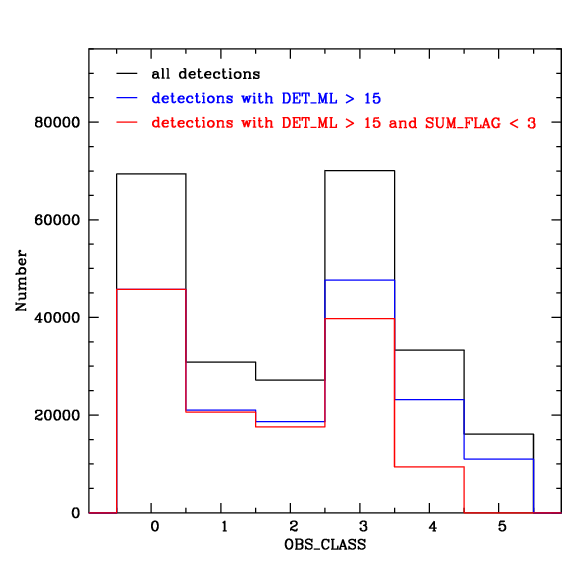
Figure 5.15: Distribution of observation class for all detection (black), for detections with a maximum likelihood EP_DET_ML > 15 (blue), and for the 'clean' detections (with the manual flag [11] set to F, or SUM_FLAG < 3) with the same likelihood cut-off.