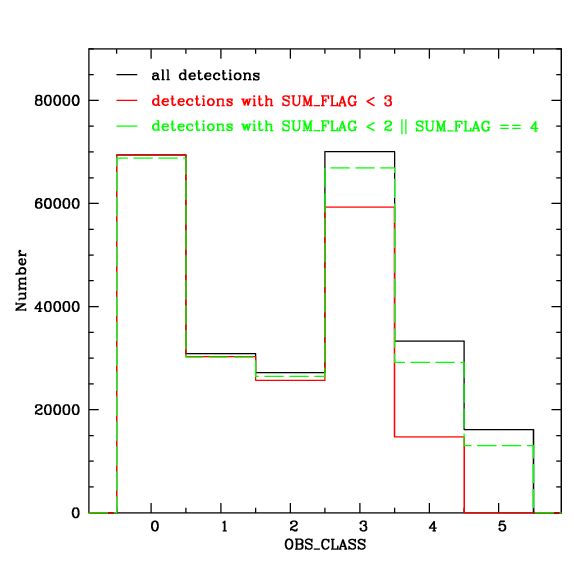
Figure 5.13: Distribution of observation class for all detections (black), 'clean' detections (with the manual flag [11] set to F, or SUM_FLAG < 3) in red, and detections which have not received an automatic flag for possible spurious detections (SUM_FLAG < 2 || SUM_FLAG = 4) in green.