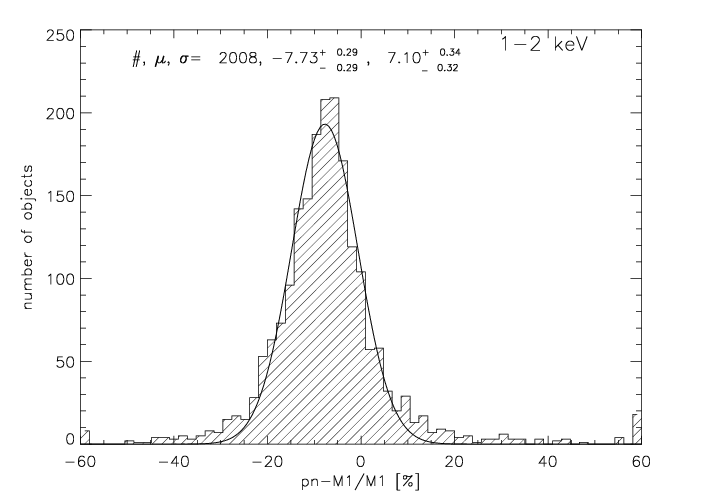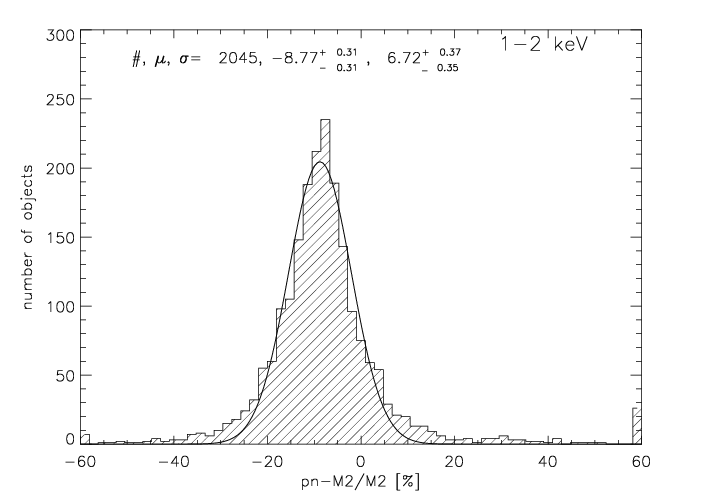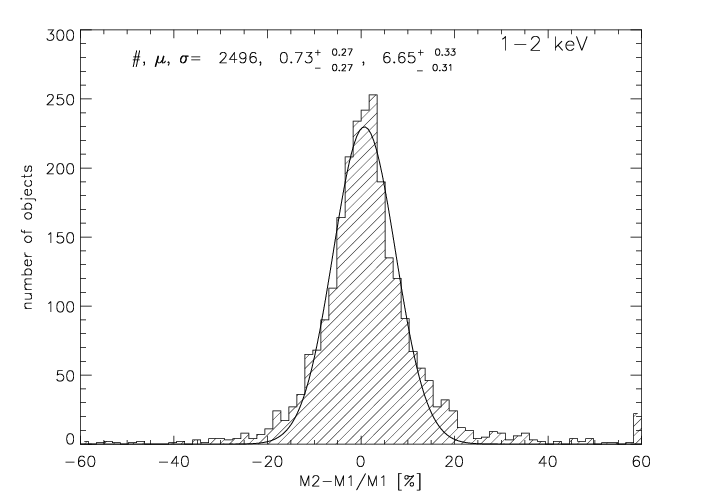


Figure 5.12: Distributions of the difference in flux between EPIC cameras. Top: comparison of PN-M1 fluxes; middle: comparison of PN-M2 fluxes; bottom: comparision of M2-M1 fluxes. Each plot also shows the number # of detections included in the analysis and results of the fitting of the observed distributions with a Gaussian model (mean μ and dispersion σ of the distribution).