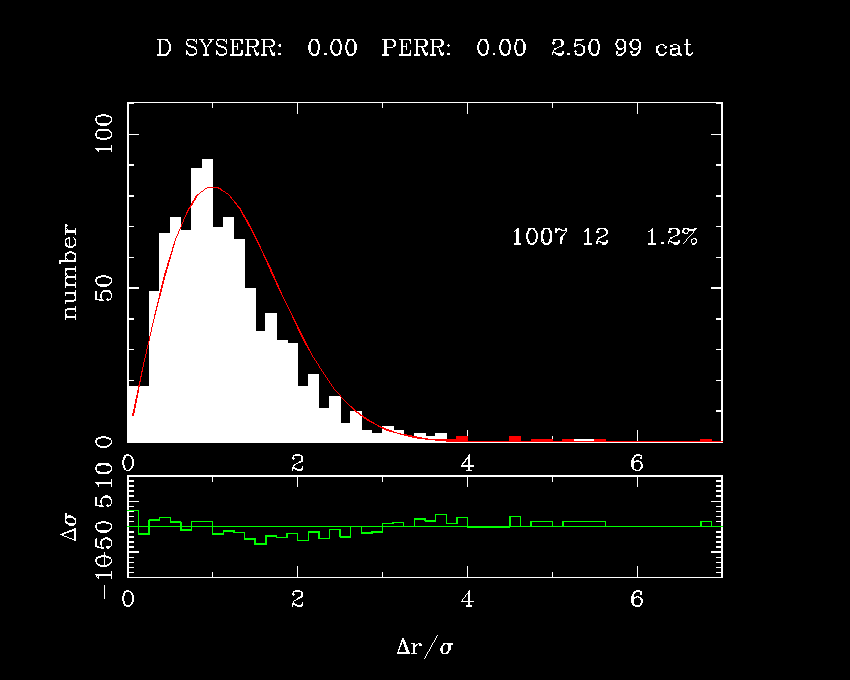
Figure 5.11: Distribution of XMM - SDSS offsets, normalised by the position error, where the systematic of 0.35" is adopted (solid white histogram). Solid red histogram: outliers above 3.7σ. Red curve: expected distribution. Lower green histogram: difference between observed and expected distributions. The deficit regarding the expectation between 1 < Δr / σ < ~ 2 are probably due to the fitting task emldetect overestimating the errors slightly.